※ 기존에 기록해둔 노션 글을 옮겨적은 것으로, 노션 템플릿에 맞게 적게된 글이라 해당 링크를 통해 더 가독성있게 보실 수 있습니다.
https://www.notion.so/2690661ce62880aea2ddeaa87e17e48f
모니터링 구축하기 - 태그기반 팀별 대시보드 구성 및 추이기반 알람 세팅까지 | Notion
1. 사전 작업 🔨
pleasant-sand-55a.notion.site
1. 사전 작업 🔨
백엔드 서버와 helm chart에서 사전에 작업해야하는 것들입니다.
1-1) 백엔드 서버
build.gradle에 프로메테우스 레지스트리 의존성 추가
implementation 'io.micrometer:micrometer-registry-prometheus'
build.gradle에 actuator 의존성 추가
implementation 'org.springframework.boot:spring-boot-starter-actuator'
applications.properties(혹은 yaml)에 아래를 추가
management:
  endpoints:
    web:
      exposure:
        include: health,info,prometheus

  endpoint:
    health:
      probes:
        enabled: true   # /actuator/health/liveness, /readiness 활성화
    prometheus:
      enabled: true

  metrics:
    distribution:
      percentiles-histogram: # HTTP 히스토그램(퍼센타일) 활성화 권장
        http:
          server:
            requests: true
+) securityConfig가 설정되어있는 서버라면 SecurityFilterChain을 아래와 같이 추가
(/actuator/prometheus 등 프로메테우스 관련 actuator 경로를 노출시켜주어야 합니다.)
https://github.com/Reciping/reciping-ads-service-BE/commit/6ca4a3cb99d81fecb793755bba0b99f72f87aa60
:recycle: refactor : permit for monitoring health check · Reciping/reciping-ads-service-BE@6ca4a3c
+ .requestMatchers("/actuator/health", "/actuator/health/**", "/actuator/info", "/actuator/prometheus").permitAll()
github.com
1-2) helm chart
요약 : 각 서비스의 기존 helm chart에서 podmonitor.yaml, rollout.yaml, values.yaml 수정 필요
각 서비스의 podmonitor.yaml 추가 (아래 깃헙에서 코드 확인)
reciping-k8s-resources/charts/reciping-user-service/templates/podmonitor.yaml at dev · Reciping/reciping-k8s-resources
AI기반 통합 레시피 추천 및 검색 플랫폼 '레시핑' - Helm chart, ArgoCD, Manifest, Monitoring, kubectl - Reciping/reciping-k8s-resources
github.com
reciping-k8s-resources/charts/reciping-ads-service/templates/podmonitor.yaml at dev · Reciping/reciping-k8s-resources
AI기반 통합 레시피 추천 및 검색 플랫폼 '레시핑' - Helm chart, ArgoCD, Manifest, Monitoring, kubectl - Reciping/reciping-k8s-resources
github.com
기존 각 서비스 helm chart에 team 태그를 추가해야 합니다.
# 각 helm chart의 values.yaml에 team 추가 (예시 : 유저팀)
# reciping-k8s-resource/charts/reciping-user-service/values.yaml
team: user
그리고 values.yaml에도 actuator 경로 노출(각 서비스 helm chart의 values.yaml 경로 참고하기)
metrics:
  prometheus:
    enabled: true
    path: /actuator/prometheus
    port: 8080
    podMonitor:
      enabled: true
rollout.yaml에 업데이트한 team 태그 환경변수로 추가
reciping.io/team: {{ .Values.team }}
⬇️ 이런 식으로 수정합니다.
https://github.com/Reciping/reciping-k8s-resources/commit/2782c5165c6c9392614d20d3538350062ef39394
:recycle: refactor : set team tag · Reciping/reciping-k8s-resources@2782c51
checksum/config: {{ include (print $.Template.BasePath "/configmap.yaml") . | sha256sum }}
github.com
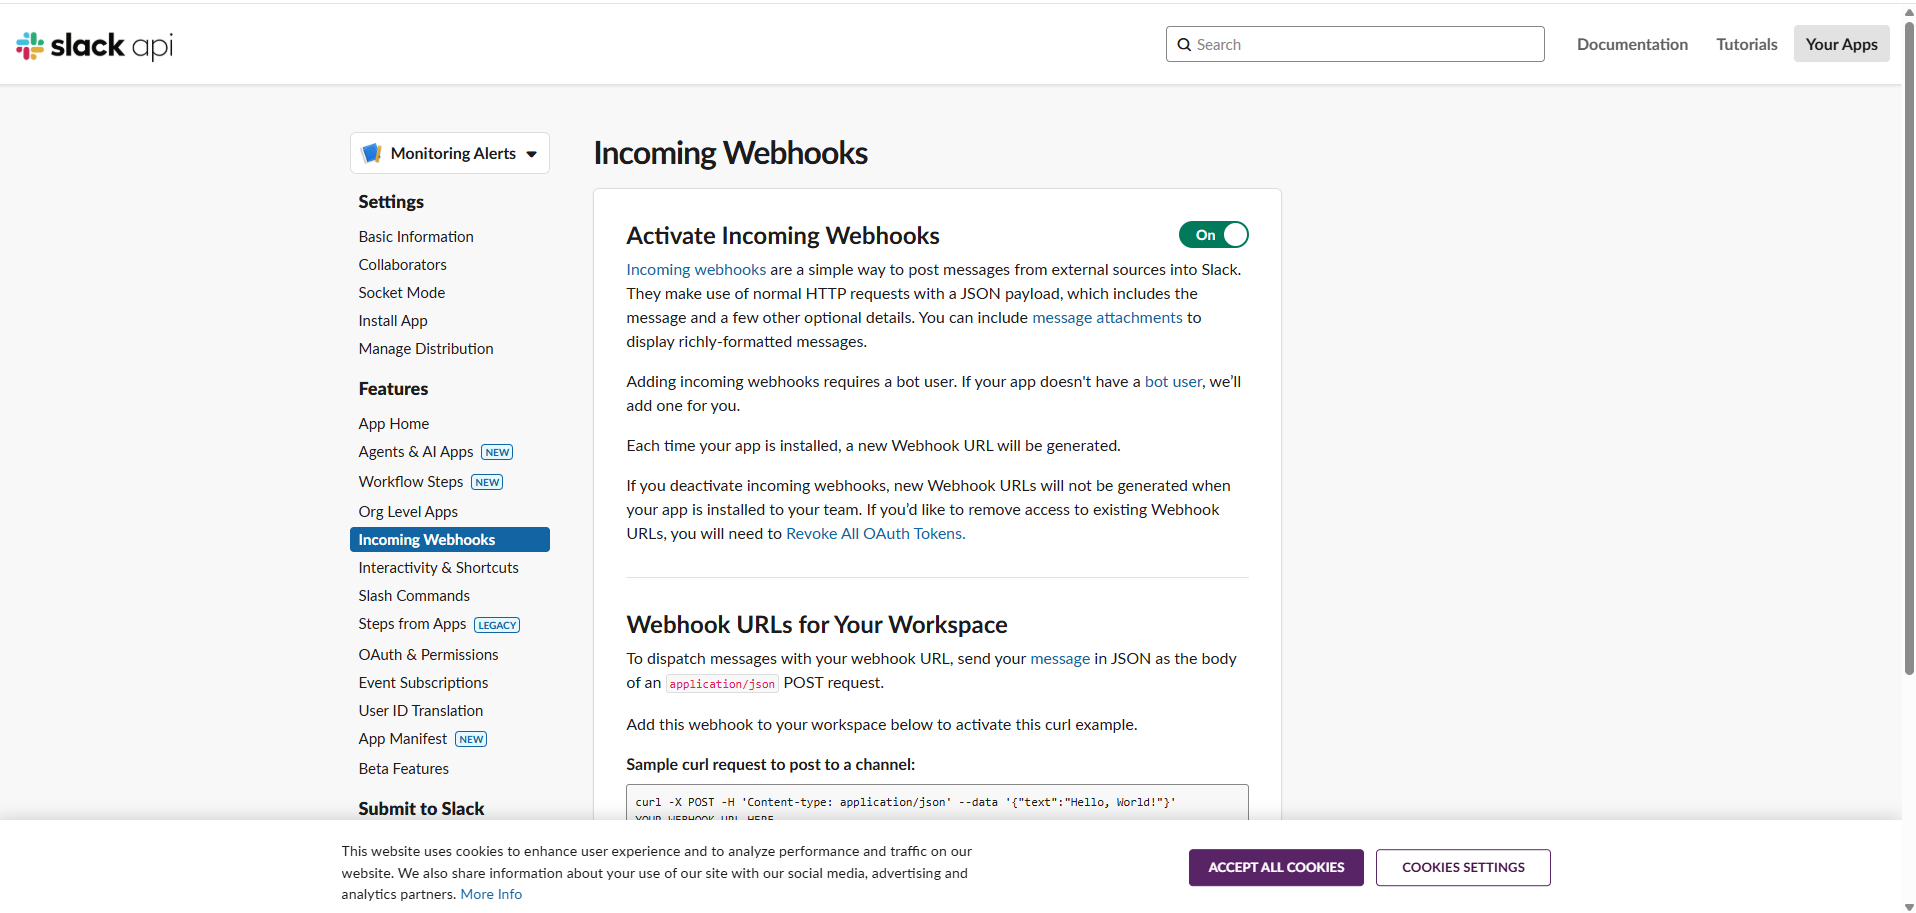
2. Slack으로 임계치 알람받기 📯
slack webhook url이 필요하기 때문에 그 작업을 먼저 해주겠습니다.
slack 앱 디렉토리 접속
Slack API: Applications | Slack
Your Apps Don't see an app you're looking for? Sign in to another workspace.
api.slack.com


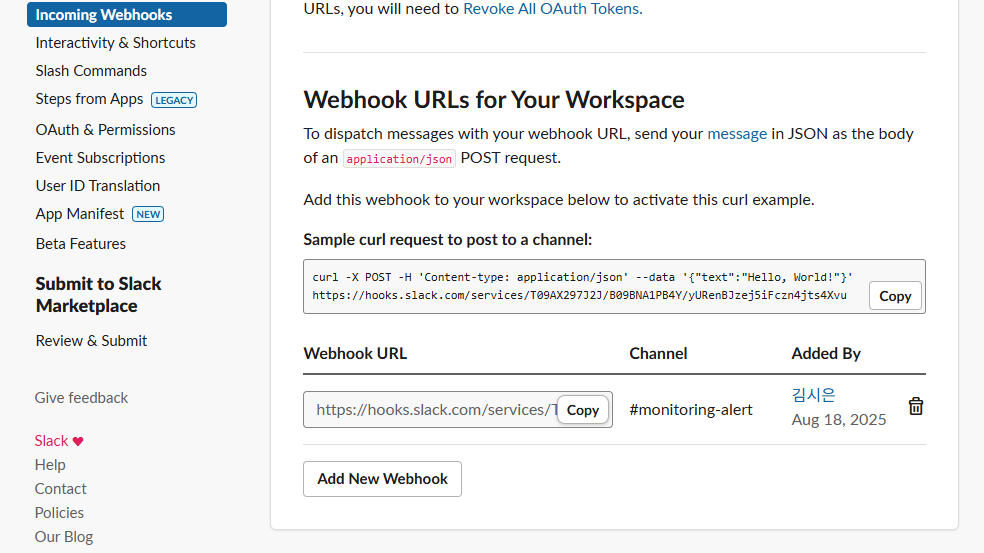

해당 URL을 Copy해서 kube-prometheus-stack관련 설정 파일(저장소, 대시보드, Grafana Ingress(ALB)/PVC, Alertmanager 팀별 라우팅(ads/user)등..) values.yaml을 세팅합니다.
최종 완성본은 아래를 참고하세요.
https://github.com/Reciping/reciping-k8s-resources/blob/dev/monitoring/values.yaml
reciping-k8s-resources/monitoring/values.yaml at dev · Reciping/reciping-k8s-resources
AI기반 통합 레시피 추천 및 검색 플랫폼 '레시핑' - Helm chart, ArgoCD, Manifest, Monitoring, kubectl - Reciping/reciping-k8s-resources
github.com
+) Alert rule 세팅하기 - 추이기반(베이스라인) 알람 세팅까지 📈
그리고 PromQL을 커스텀으로 세팅해서 어떤 hook에 알람을 받을지 정의합니다.
1. 일반 alerts hook 세팅
< 설정 설명 1 >
http-availability :
- ServiceErrorRateHighWarning: 5xx 비율 > 5% 10분
- ServiceErrorRateHighCritical: 5xx 비율 > 10% 5분
- ServiceInstancesDown: 해당 서비스 타겟 up이 0 → 2분
http-latency :
- ServiceLatencyP95High: P95 > 500ms 10분
- ServiceLatencyP99High: P99 > 1s 5분
jvm-and-runtime :
- JvmHeapUsageHigh: heap 사용률 > 90% 10분
- ContainerRestarts: 5분 내 재시작 발생 시 경고
reciping-k8s-resources/manifests/monitoring/rules/service-prod-rules.yaml at dev · Reciping/reciping-k8s-resources
AI기반 통합 레시피 추천 및 검색 플랫폼 '레시핑' - Helm chart, ArgoCD, Manifest, Monitoring, kubectl - Reciping/reciping-k8s-resources
github.com
2. 추이 기반(베이스라인) alerts hook 세팅
< 설정 설명 2 >
http-anomaly :
- ServiceTrafficAnomaly: 최근 5분 RPS가 1시간 평균 대비 3σ 초과(그리고 RPS>0.1) 10분
- ServiceErrorRateAnomaly: 최근 5분 에러율이 1시간 평균 대비 3σ 초과(그리고 RPS>0.1) 10분
reciping-k8s-resources/manifests/monitoring/rules/service-anomaly-rules.yaml at dev · Reciping/reciping-k8s-resources
AI기반 통합 레시피 추천 및 검색 플랫폼 '레시핑' - Helm chart, ArgoCD, Manifest, Monitoring, kubectl - Reciping/reciping-k8s-resources
github.com
3. monitoring app 배포하기 🛥️
ArgoCD 기반으로 모니터링툴도 배포할 것입니다. monitoring-app.yaml도 작성해줍니다.
(Helm 차트 + manifests/monitoring 동시 적용)
https://github.com/Reciping/reciping-k8s-resources/blob/dev/app/monitoring-app.yaml
reciping-k8s-resources/app/monitoring-app.yaml at dev · Reciping/reciping-k8s-resources
AI기반 통합 레시피 추천 및 검색 플랫폼 '레시핑' - Helm chart, ArgoCD, Manifest, Monitoring, kubectl - Reciping/reciping-k8s-resources
github.com
EBS CSI 드라이버 설치 기반 Storage Class(gp3 혹은 gp2) 정의 - PVC
https://github.com/Reciping/reciping-k8s-resources/blob/dev/manifests/storage/gp2-csi.yaml
reciping-k8s-resources/manifests/storage/gp2-csi.yaml at dev · Reciping/reciping-k8s-resources
AI기반 통합 레시피 추천 및 검색 플랫폼 '레시핑' - Helm chart, ArgoCD, Manifest, Monitoring, kubectl - Reciping/reciping-k8s-resources
github.com
Storage Class는 ebs.csi.aws.com 프로비저너가 있어야 합니다. Add-on이 없다면 설치가 필요합니다.
(설치되어 있지 않다면 콘솔에서 EBS CSI 활성화 해주기)
# 클러스터 이름 먼저 확인
aws eks list-clusters --region ap-northeast-2

# EKS Add-on 설치
eksctl enable addon --name aws-ebs-csi-driver --cluster <cluster-name> --region ap-northeast-2
# IRSA 역할 생성 + SA에 주입
eksctl create iamserviceaccount \
--cluster reciping-cluster \
--namespace kube-system \
--name ebs-csi-controller-sa \
--role-name AmazonEKS_EBS_CSI_DriverRole \
--attach-policy-arn arn:aws:iam::aws:policy/service-role/AmazonEBSCSIDriverPolicy \
--override-existing-serviceaccounts \
--approve \
--region ap-northeast-2
# EKS 애드온에 역할 연결
aws eks update-addon \
--cluster-name reciping-cluster \
--addon-name aws-ebs-csi-driver \
--service-account-role-arn <위 Role ARN> \
--region ap-northeast-2# 선택사항) 드라이버 준비 확인 - 두 리소스가 모두 Ready여야 함.
# 컨트롤러 확인
kubectl -n kube-system get deploy ebs-csi-controller
# 노드 컴포넌트 확인
kubectl -n kube-system get ds ebs-csi-node
-------
# 나중에 배포됐을 경우, PVC 이벤트 확인할 때 사용하는 명령어
# Events에 'provisioned' / 'bound' 메시지가 뜨면 정상
kubectl -n monitoring get pvc
kubectl -n monitoring describe pvc kube-prometheus-stack-grafana
monitoring 네임스페이스 만들기
# yaml에 네임스페이스까지 자동으로 만드는 것까지 정의되어있으나, 혹시 모르니 미리 만들어두기
kubectl create namespace monitoring
모니터링 앱 배포하기
kubectl apply -n argocd -f app/monitoring-app.yaml
결과 :
사전에 웹훅 발생시킬 수 있는 명령어 입력 후, 제대로 동작하는지 확인
참고) Container sleep 임의 발생 후, Restart 명령어
POD=$(kubectl -n reciping get pod -l app=reciping-user-service -o jsonpath='{.items[0].metadata.name}')
CNTR=$(kubectl -n reciping get pod "$POD" -o jsonpath='{.spec.containers[0].name}')

# 먼저 정상 동작하는지 테스트: 시그널 거부면 Permission denied가 뜸
kubectl -n reciping exec "$POD" -c "$CNTR" -- sh -c 'kill -s TERM 1 || true'
sleep 2
kubectl -n reciping exec "$POD" -c "$CNTR" -- sh -c 'kill -s KILL 1 || true'
kubectl -n monitoring port-forward svc/kube-prometheus-stack-prometheus 9090:9090
# 브라우저 → http://localhost:9090/rules → service-prod-rules 확인
# 또는 Alertmanager에서 Firing 시 Slack 메시지 한글 문구 확인

# alertmanager는 아래로 포트포워딩 후 확인
kubectl -n monitoring port-forward svc/kube-prometheus-stack-alertmanager 9093:9093
# 브라우저 http://localhost:9093/#/alerts → 동일 알람 Firing 확인
# Slack: #user-alerts, #ads-alerts 채널로 도착 확인


+) 영상 기록
Route53에서 와일드카드(*.reciping.kr)을 정의해두고 있어서 ACM ARN 적용하면 되니, https://grafana.reciping.kr 연결 쉽게 가능
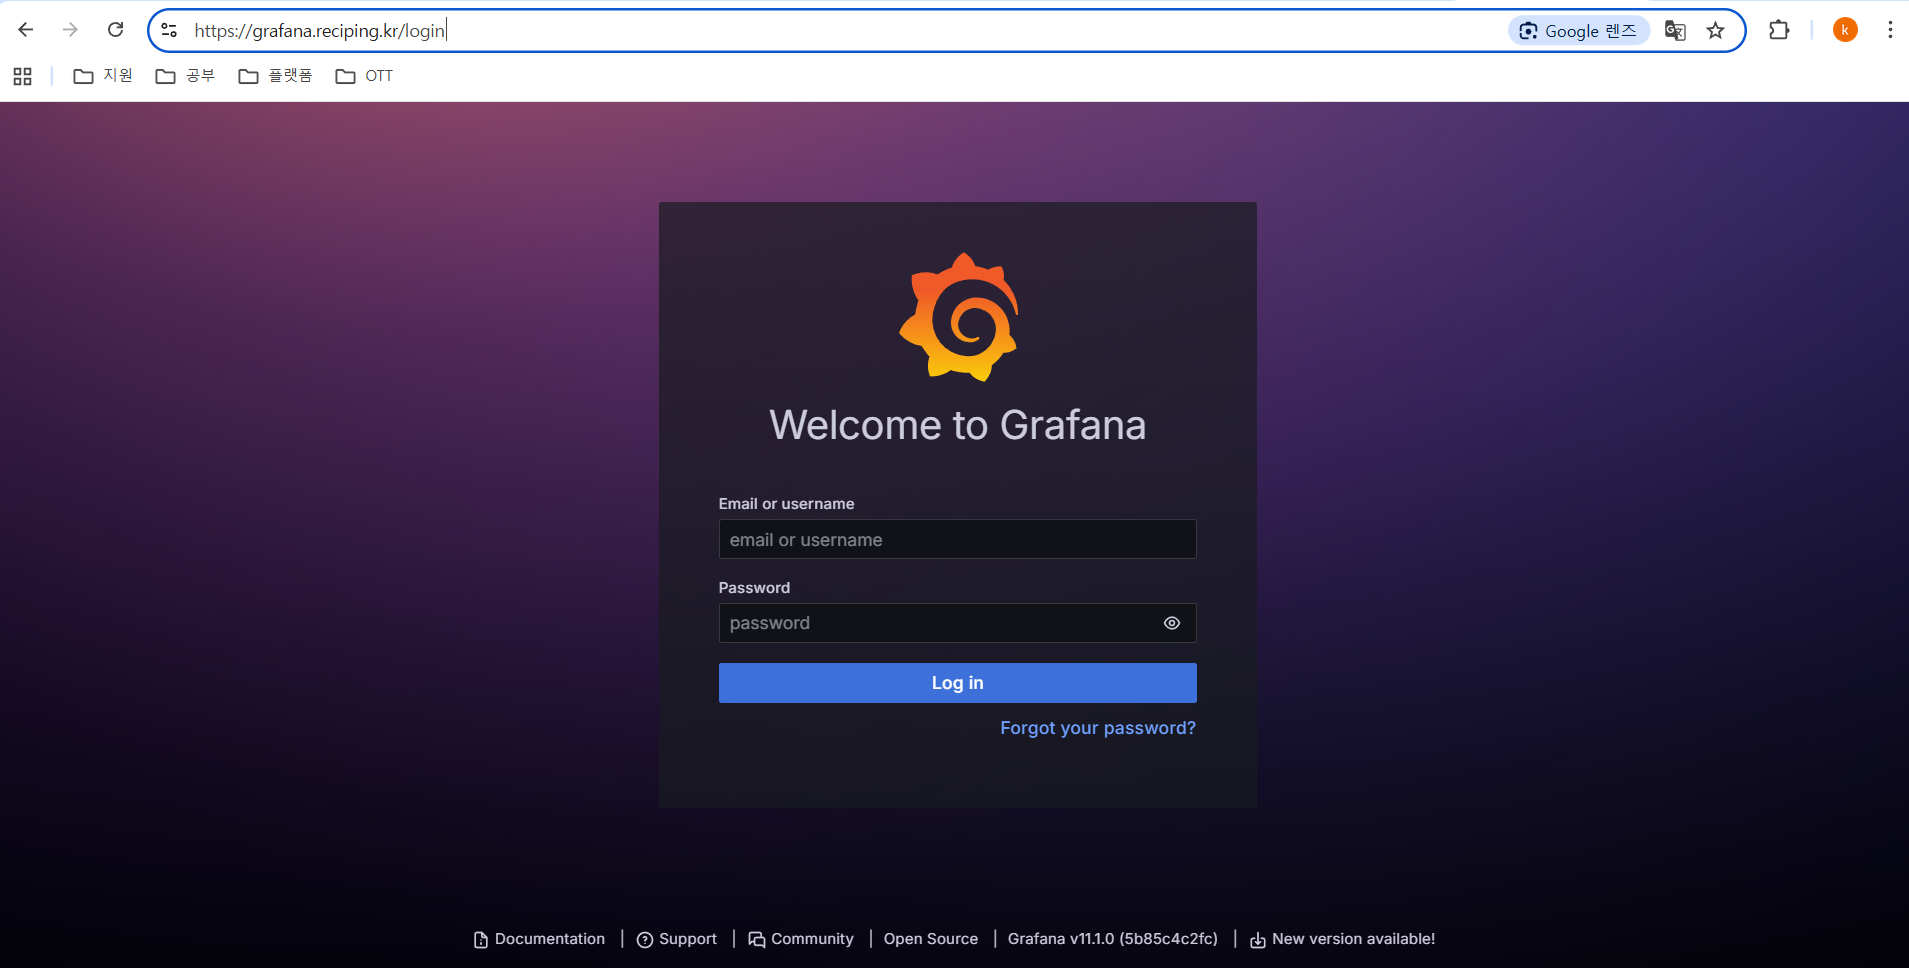
# 초기 username/password 아는 법

# username
kubectl -n monitoring get secret kube-prometheus-stack-grafana -o jsonpath='{.data.admin-user}' | base64 -d; echo
# password
kubectl -n monitoring get secret kube-prometheus-stack-grafana -o jsonpath='{.data.admin-password}' | base64 -d; echo
4. 태그 기반으로 팀별 대시보드 구성하기 🔖
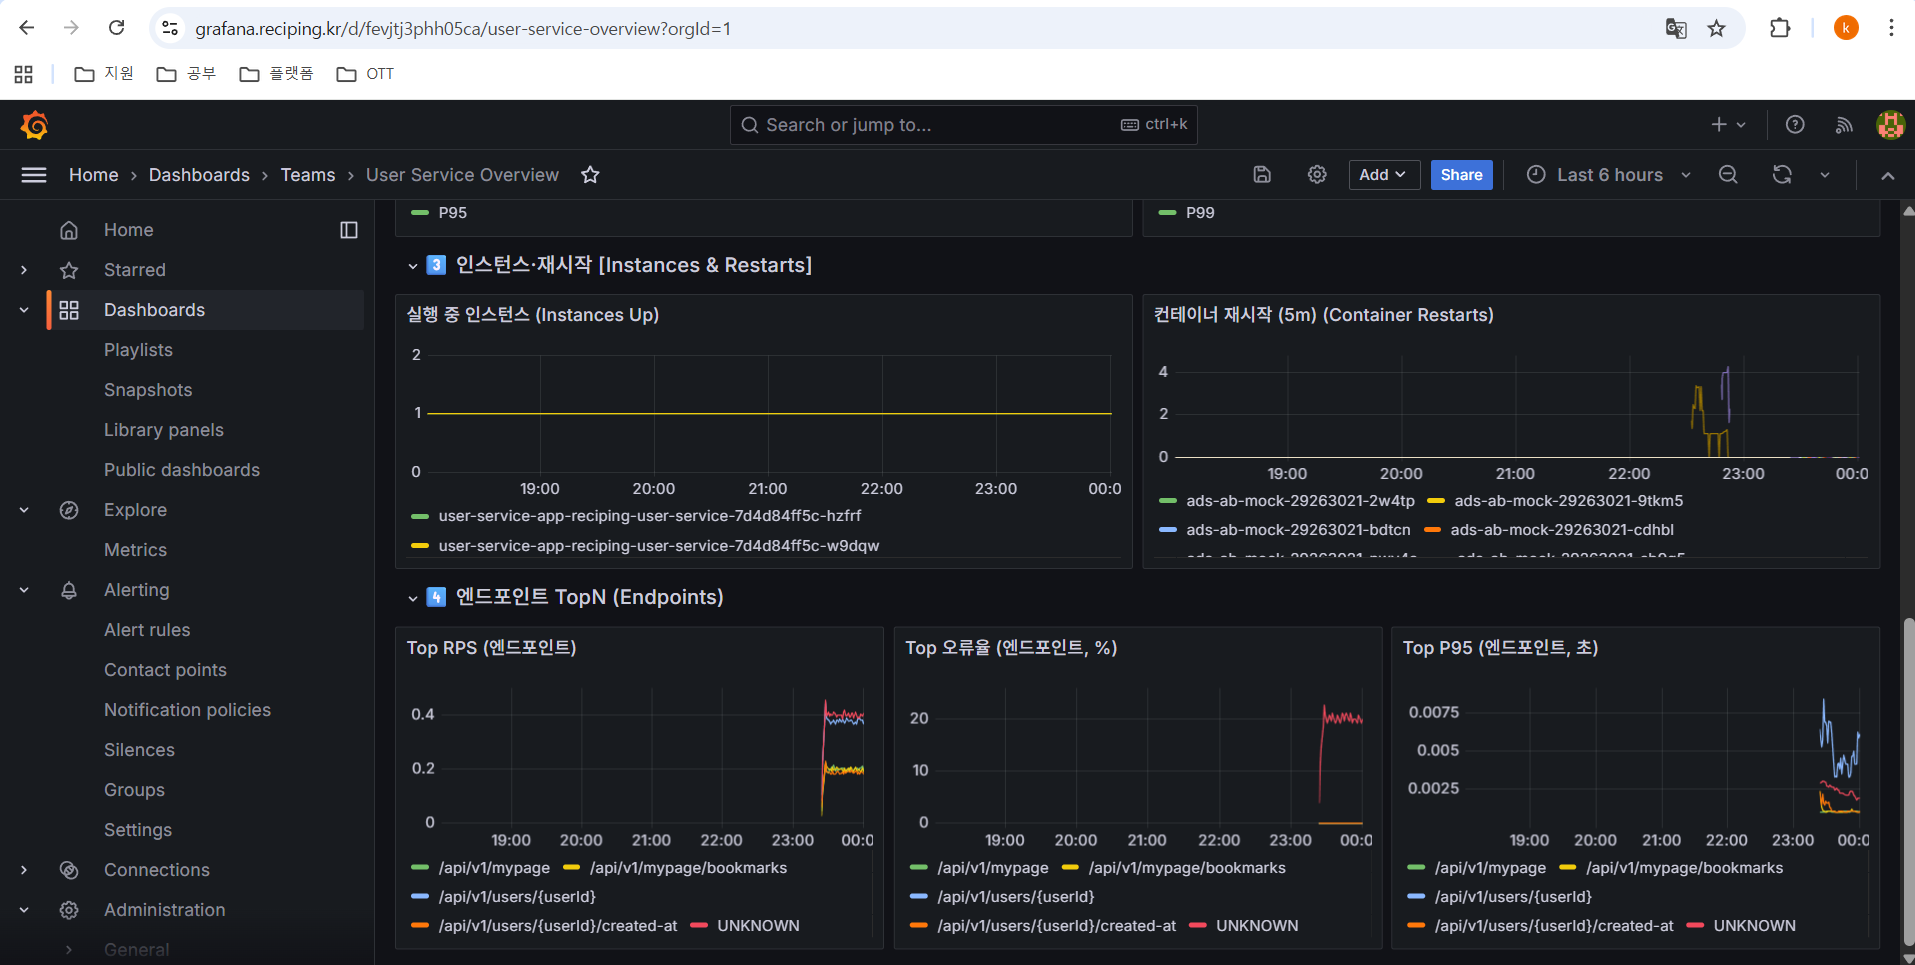
이미 태그 기반으로 대시보드가 나타나게는 구성이 되어있으나, 팀별 커스텀한 대시보드는 따로 구성해야 합니다.
1) 부서별 대시보드 구성 yaml 파일 추가 후, 모니터링 앱 재배포하기
reciping-k8s-resources/manifests/monitoring/dashboards/user-service-overview.yaml at dev · Reciping/reciping-k8s-resources
AI기반 통합 레시피 추천 및 검색 플랫폼 '레시핑' - Helm chart, ArgoCD, Manifest, Monitoring, kubectl - Reciping/reciping-k8s-resources
github.com
reciping-k8s-resources/manifests/monitoring/dashboards/ads-service-overview.yaml at dev · Reciping/reciping-k8s-resources
AI기반 통합 레시피 추천 및 검색 플랫폼 '레시핑' - Helm chart, ArgoCD, Manifest, Monitoring, kubectl - Reciping/reciping-k8s-resources
github.com
+) advanced 대시보드를 하나 더 만들어서 알람배지(패널링크)로 Alertmanager/Explore 링크 추가도 가능
💡 여기서 알람 배지(패널링크)란?
: 대시보드 상단에 작은 통계 배지 패널(예: “Active Alerts”)을 두고, 배지를 클릭하면 Alert 상세 페이지나 Explore/Alertmanager로 바로 이동하는 “패널 링크”를 붙이는 것
배지에 아래처럼 링크를 붙일 수 있습니다 ⬇️
- Alertmanager UI: /alertmanager/#/alerts?filter=reciping_team%3Duser
- Explore(사전 쿼리 포함): /explore?left=...ALERTS%7Breciping_team%3D%22user%22%7D...
+) 해당 advanced 대시보드 yaml 코드
apiVersion: v1
kind: ConfigMap
metadata:
  name: grafana-dashboard-user-service-advanced
  namespace: monitoring
  labels:
    grafana_dashboard: "1"
  annotations:
    grafana_folder: "Teams"
data:
  user-service-advanced.json: |
    {"schemaVersion":39,"version":1,"title":"User Service Advanced","tags":["team:user"],"time":{"from":"now-6h","to":"now"},
     "templating":{"list":[
       {"name":"team","type":"constant","label":"team","query":"user","hide":2},
       {"name":"service","type":"constant","label":"service","query":"reciping-user-service","hide":2},
       {"name":"endpoint","type":"custom","label":"endpoint","query":"^/api/v1/users/signup$,^/api/v1/users/.*/created-at$,^/api/v1/users/me$,^/api/v1/mypage$,^/api/v1/mypage/bookmarks$,^/api/v1/auth/refresh$","includeAll":true,"allValue":".*","multi":true,"current":{"text":"All","value":["$__all"]}}
     ]},
     "panels":[
      {"type":"row","title":"Badges","collapsed":false,"gridPos":{"h":1,"w":24,"x":0,"y":0}},
      {"type":"stat","title":"Active Alerts (User)","gridPos":{"h":3,"w":6,"x":0,"y":1},
       "targets":[{"expr":"count(ALERTS{alertstate=\"firing\",reciping_team=\"user\"})"}]},
      {"type":"stat","title":"5xx Error Rate (%)","gridPos":{"h":3,"w":6,"x":6,"y":1},
       "targets":[{"expr":"100 * ( sum(rate(http_server_requests_seconds_count{namespace=\"reciping\",reciping_team=\"user\",reciping_service=\"reciping-user-service\",status=~\"5..\",uri!~\"/actuator/.*\"}[5m])) / sum(rate(http_server_requests_seconds_count{namespace=\"reciping\",reciping_team=\"user\",reciping_service=\"reciping-user-service\",uri!~\"/actuator/.*\"}[5m])) )"}]},
      {"type":"stat","title":"P95 (s)","gridPos":{"h":3,"w":6,"x":12,"y":1},
       "targets":[{"expr":"histogram_quantile(0.95, sum by (le) ( rate(http_server_requests_seconds_bucket{namespace=\"reciping\",reciping_team=\"user\",reciping_service=\"reciping-user-service\",uri!~\"/actuator/.*\"}[5m]) ))"}]},
      {"type":"stat","title":"RPS","gridPos":{"h":3,"w":6,"x":18,"y":1},
       "targets":[{"expr":"sum(rate(http_server_requests_seconds_count{namespace=\"reciping\",reciping_team=\"user\",reciping_service=\"reciping-user-service\",uri!~\"/actuator/.*\"}[5m]))"}]},
      {"type":"row","title":"Traffic & Errors","collapsed":false,"gridPos":{"h":1,"w":24,"x":0,"y":0}},
      {"type":"timeseries","title":"RPS (5m rate)","gridPos":{"h":7,"w":12,"x":0,"y":1},
       "targets":[{"expr":"sum by (uri) (rate(http_server_requests_seconds_count{namespace=\"reciping\",reciping_team=\"$team\",reciping_service=\"$service\",uri!~\"/actuator/.*\",uri=~\"$endpoint\"}[5m]))","legendFormat":"{{uri}}"}]},
      {"type":"timeseries","title":"오류율 (5m %)","gridPos":{"h":7,"w":12,"x":12,"y":1},
       "targets":[{"expr":"100 * ( sum by (uri) (rate(http_server_requests_seconds_count{namespace=\"reciping\",reciping_team=\"$team\",reciping_service=\"$service\",status=~\"5..\",uri!~\"/actuator/.*\",uri=~\"$endpoint\"}[5m])) / sum by (uri) (rate(http_server_requests_seconds_count{namespace=\"reciping\",reciping_team=\"$team\",reciping_service=\"$service\",uri!~\"/actuator/.*\",uri=~\"$endpoint\"}[5m])) )","legendFormat":"{{uri}}"}]},

      {"type":"row","title":"Latency","collapsed":false,"gridPos":{"h":1,"w":24,"x":0,"y":8}},
      {"type":"timeseries","title":"HTTP P95 (s)","gridPos":{"h":7,"w":12,"x":0,"y":9},
       "targets":[{"expr":"histogram_quantile(0.95, sum by (uri,le) ( rate(http_server_requests_seconds_bucket{namespace=\"reciping\",reciping_team=\"$team\",reciping_service=\"$service\",uri!~\"/actuator/.*\",uri=~\"$endpoint\"}[5m]) ))","legendFormat":"{{uri}}"}]},
      {"type":"timeseries","title":"HTTP P99 (s)","gridPos":{"h":7,"w":12,"x":12,"y":9},
       "targets":[{"expr":"histogram_quantile(0.99, sum by (uri,le) ( rate(http_server_requests_seconds_bucket{namespace=\\\"reciping\\\",reciping_team=\\\"$team\\\",reciping_service=\\\"$service\\\",uri!~\\\"/actuator/.*\\\",uri=~\\\"$endpoint\\\"}[5m]) ))","legendFormat":"{{uri}}"}]},

      {"type":"row","title":"Auth & Signup Funnel","collapsed":false,"gridPos":{"h":1,"w":24,"x":0,"y":16}},
      {"type":"timeseries","title":"Signup Attempts vs Success (5m)","gridPos":{"h":6,"w":12,"x":0,"y":17},
       "targets":[
        {"expr":"sum by (status) (rate(http_server_requests_seconds_count{namespace=\\\"reciping\\\",reciping_team=\\\"$team\\\",reciping_service=\\\"$service\\\",uri=\\\"/api/v1/users/signup\\\"}[5m]))","legendFormat":"signup {{status}}"},
        {"expr":"sum by (status) (rate(http_server_requests_seconds_count{namespace=\\\"reciping\\\",reciping_team=\\\"$team\\\",reciping_service=\\\"$service\\\",uri=\\\"/api/v1/auth/refresh\\\"}[5m]))","legendFormat":"auth {{status}}"}
       ]},
      {"type":"timeseries","title":"Signup P95 (s)","gridPos":{"h":6,"w":12,"x":12,"y":17},
       "targets":[{"expr":"histogram_quantile(0.95, sum by (le) ( rate(http_server_requests_seconds_bucket{namespace=\"reciping\",reciping_team=\"$team\",reciping_service=\"$service\",uri=\"/api/v1/users/signup\"}[5m]) ))","legendFormat":"signup P95"}]},

      {"type":"row","title":"My Page","collapsed":false,"gridPos":{"h":1,"w":24,"x":0,"y":23}},
      {"type":"timeseries","title":"MyPage P95 (s)","gridPos":{"h":6,"w":12,"x":0,"y":24},
       "targets":[{"expr":"histogram_quantile(0.95, sum by (le) ( rate(http_server_requests_seconds_bucket{namespace=\"reciping\",reciping_team=\"$team\",reciping_service=\"$service\",uri=\"/api/v1/mypage\"}[5m]) ))","legendFormat":"mypage P95"}]},
      {"type":"timeseries","title":"Bookmarks RPS (5m)","gridPos":{"h":6,"w":12,"x":12,"y":24},
       "targets":[{"expr":"sum(rate(http_server_requests_seconds_count{namespace=\"reciping\",reciping_team=\"$team\",reciping_service=\"$service\",uri=\"/api/v1/mypage/bookmarks\"}[5m]))","legendFormat":"bookmarks"}]},

      {"type":"row","title":"Reliability","collapsed":false,"gridPos":{"h":1,"w":24,"x":0,"y":30}},
      {"type":"timeseries","title":"Instances Up","gridPos":{"h":6,"w":12,"x":0,"y":31},
       "targets":[{"expr":"sum by (pod) (up{namespace=\"reciping\",reciping_service=\"$service\"})","legendFormat":"{{pod}}"}]},
      {"type":"timeseries","title":"컨테이너 재시작 (5m)","gridPos":{"h":6,"w":12,"x":12,"y":31},
       "targets":[{"expr":"sum by (pod) (increase(kube_pod_container_status_restarts_total{namespace=\"reciping\"}[5m]))","legendFormat":"{{pod}}"}]}
     ]}
# 재배포 후, health 확인까지 하는 명령어
argocd app sync kube-prometheus-stack --grpc-web && argocd app wait kube-prometheus-stack --health --timeout 600 | cat결과 :


+) 영상 기록
'Project > reciping' 카테고리의 다른 글
| [reciping 3차] 서비스에 맞춰 배포 전략을 직접 비교해봐요! - 장/단점 정리 (1) | 2025.11.05 |
|---|---|
| [reciping 3차]Terraform으로 EKS 기반 인프라 구축하기 (2) (0) | 2025.11.05 |
| [reciping 3차]Terraform으로 EKS 기반 인프라 구축하기 (1) (0) | 2025.11.05 |
| [reciping 2차] minikube로 로컬 쿠버네티스 테스트하기 (0) | 2025.11.05 |
| [reciping] 프론트단의 Route53 + S3 + CloudFront 설정하기 (0) | 2025.11.05 |